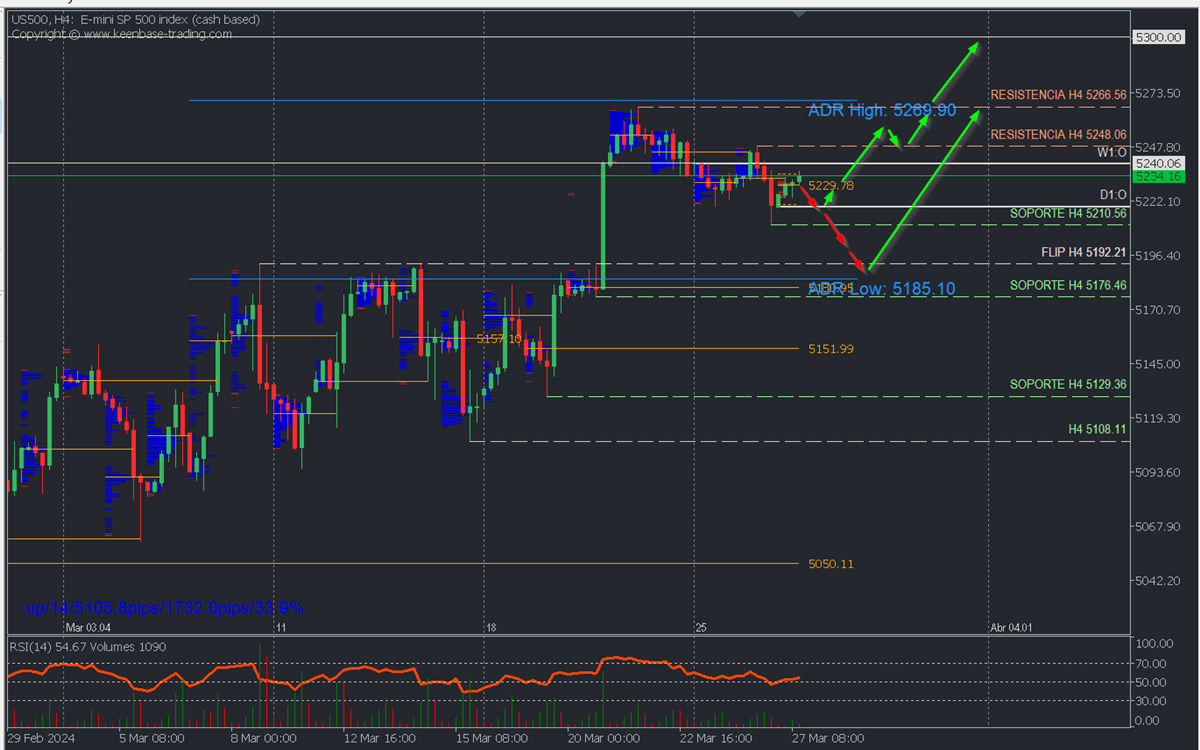
- Bearish Scenario: Sales below 5220 with TP1: 5210 and TP2: 5192.21 with S.L. above 5248 or at least 1% of account capital*.
- Bullish Scenario: Buys above 5225 (if price fails to break below decisively) with TP1: 5235, TP2: 5242, TP3: 5248, TP4: 5255, TP5: 5290, and TP6 (Swing): 5300 with S.L. below 5210 or at least 1% of account capital*. Apply trailing stop
Scenario from H4 chart:
US500 continues within a macro bullish trend and has been undergoing a corrective phase since late last week, which has covered 50% of the volume inefficiency (gap) from Wednesday after the Fed meeting.
This correction is leaving the level 5248.06 as the last relevant resistance, implying that until this level is broken with two confirming bullish moves. The price respects the last selling zone around 5233, the current correction could extend towards the flip level (resistance turned support) at 5192.21 and the buying zone around 5180 - 5185, very close to the last intraday support at 5176.46.
This decline towards the nearest buying zone from last week will activate the bulls to trigger a new price rally towards the selling zones left by the decline until they are broken to extend purchases.
On the other hand, the decisive breakout of Tuesday's buying zone at 5233 will test the weekly opening (W1:O) and the last relevant resistance at 5248.06, whose decisive breakout with a candle body or two confirming moves will renew the bullish trend-seeking to surpass last week's resistance and current all-time high at 5266.56 with a target in the coming days or weeks to reach 5300. RSI above 50 confirms the corrective scenario and bull dominance.
*Uncovered POC: POC = Point of Control: It is the level or zone where the highest volume concentration occurred. If there was a bearish movement from it previously, it is considered a selling zone and forms a resistance zone. On the contrary, if there was a bullish impulse previously, it is considered a buying zone, usually located at lows, thus forming support zones.
**Consider this risk management suggestion
**It is important that risk management be based on capital and traded volume. For this, a maximum risk of 1% of capital is recommended. It is suggested to use risk management indicators like the Easy Order.
Disclaimer
This document does not constitute a recommendation to buy or sell financial products and should not be considered as a solicitation or offer to engage in transactions. This document is an economic research of the author and does not intend to provide investment advice or solicit securities or other types of investment transactions in FBS. Although all investment involves some risk, the risk of loss in trading forex and other leveraged assets can be substantial. Therefore, if you are considering trading in this market, you should be aware of the risks associated with this product to make informed decisions before investing. The material presented here should not be interpreted as advice or trading strategy. All prices mentioned in this report are for informational purposes only.